
Could you use some help locating simple financials in Clarity PPM (CA PPM), like Forecast Cost? We'll cover that today, plus two other tips: granting Instance Manager access (BO) and making sure the Capacity vs Demand by Resource Report runs the way you need it to.
Please feel free to comment on any alternative answers you've found. At Rego, we always love your input.
Learn with Rego | Q&A
1. Simple financials in Clarity—where are they?
2. BusinessObjects Instance Manager access, Clarity On-Demand
3. Report Question
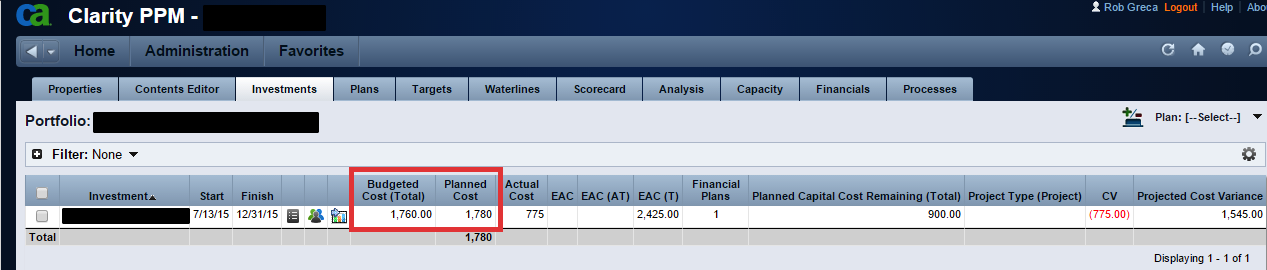
1. I'd like to understand and compare the original budget to the latest forecast (planned cost). In the screenshot below, I’ve setup a portfolio with one project.
In this example, I have a budget plan that totals 1760, and I’ve updated my latest cost plan to reflect 1780. How do I display the $20 variance?
A. The Forecast Cost and Budget to Forecast Cost Variance is available in the Portfolio, on the Financials tab.
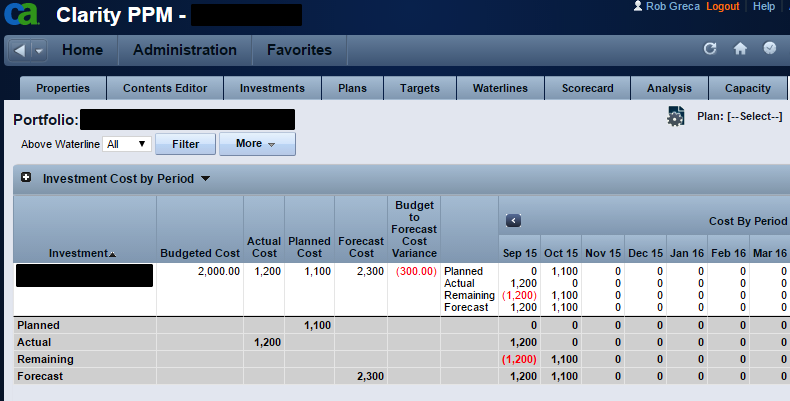
B. If you want to see the change between the new cost plan and the budget, just go to the financial summary page. It will show you the plan of record (total) and the budget (total). You can also add the budget field to the hierarchy tab and you should see the difference there.
2. Does anyone have the proper request syntax to use the instance manager, via Clarity On-Demand support? The instance manager's duration column allows us to cycle through time and look at how long each report took. I believe this can be done with access control BusinessObjects, but I don't have the notes on how to request it.
The Business Objects instance manager is useful for seeing how long reports run and report history. The instance manager can't view all report history, which is key for performance analysis.
Resolution
• Login to CMC > User and Groups
• Highlight the required group, right click on it, and click Add members to group
• Add users from the list of users available and click OK
• From the dropdown at the top, select Applications
• Right click on CMC > Manage > Security > User Security
• Click on Add Principals
• Add the required group and click on Add and Assign security
• Uncheck the Inheritance and click on Advanced > Add/Remove Rights
• Expand Application and click on CMC
• From the right side pane, choose Granted option for "Allow access to Instance Manager"
• Click on Apply and then OK
• Now when logged into CMC with the user from the above group, they see the Instance Manager.
3. When we run the Capacity vs. Demand by Resource report, from the start of the current year, we get all zeros (not error). Does anyone know where this report gets its data?
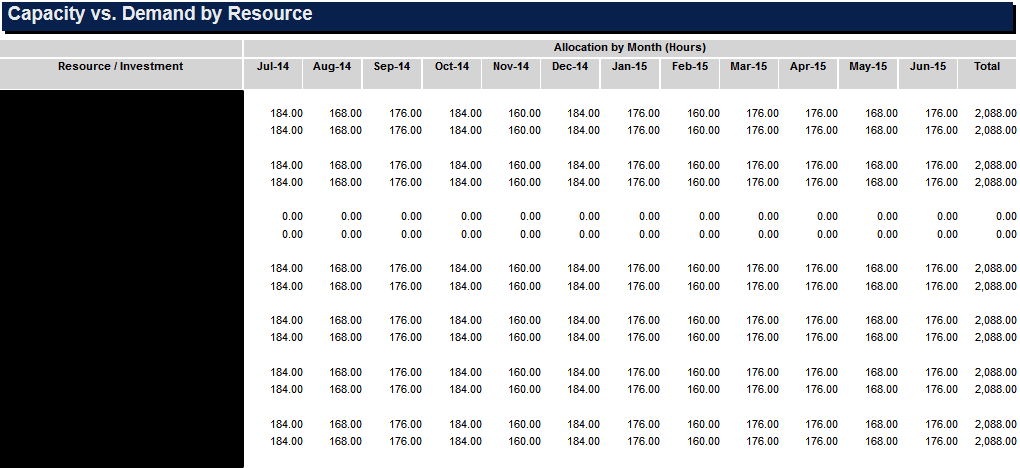
This is likely related to the availcurve and alloccurve time slices. You'll need to make sure these time slices are capturing a sufficient number of periods for the report to run. See comments below from the Solution Pack Product Guide.
From the CSP doc - Report Prerequisites:
- "Resource capacity amounts display if the resource has availability defined and meets the parameter criteria."
- "Resource demand allocation amounts display if the resource is allocated to at least one investment and the report displays type of hours as allocations. Resource demand assignment amounts display if the resource is assigned to at least one task on the investment and the report displays type of hours as assignments."
- "The capacity amounts are calculated based on the time slices with the name MONTHLYRESOURCEAVAILCURVE and WEEKLYRESOURCEAVAILCURVE (Administration/Data Administration-Time Slices). These time slices must be configured to cover the periods displayed in this report or the report will not display data for those periods."
- "When the report displays type of hours as allocations, the demand amounts are calculated based on the time slices with the name MONTHLYRESOURCEALLOCCURVE and WEEKLYRESOURCEALLOCCURVE (Administration/Data Administration-Time Slices). These time slices must be configured to cover the periods displayed in this report or the report will not display data for those periods."
- "When the report displays type of hours as assignments, the demand amounts are calculated based on the time slices with the name MONTHLYRESOURCEACTCURVE and WEEKLYRESOURCEACTCURVE; and MONTHLYRESOURCEESTCURVE and WEEKLYRESOURCEESTCURVE (Administration/Data Administration-Time Slices). These time slices must be configured to cover the periods displayed in this report or the report will not display data for those periods.
Thank You------------------------------
A special thank you to Mindy Calderon, Rob Greca, Kelly Limbeg, and the Rego Guides for this Q/A material.
Let Rego Be Your Guide
Join us live and in-person at RegoUniversity in San Diego Sept 29-Oct 2 and learn from the expert guides who deliver Clarity PPM and Agile services to 60% of Fortune 20 companies. Act now to save $300 on Early Bird Pricing until July 1st.
Rego also offers free health assessments, webinars, and half-day training classes for Clarity PPM on Roadmaps in the Modern UX, Power BI, Portfolio Management, and Jaspersoft.
For a full list of Clarity Services, visit regoconsulting.com.