
In the latest free Jaspersoft training from Rego, we'll show you how to make a Masterful Jaspersoft Dashboard in just five minutes. Rather than moving from report to report to report, the dashboard below gives you one view for drilling into Projects by Stage.
In recent Jaspersoft posts, we’ve shown you how to create the foundation for this speedy dashboard by starting your ad hoc report from scratch, creating a table for an active project report, adding status indicators to your Jaspersoft report, creating a crosstab report for allocations and assignments by project, and making a Jaspersoft chart with project count, stage, and status. And we did it all in Clarity PPM (CA PPM), where you can now email Jaspersoft reports to anyone.
Today we pull those reports together in one magnificent dashboard with guidance from Atul Kunkulol, who shared this trick in Part 1 of our Free Jaspersoft 6.1 Webinar series.
Jaspersoft Dashboard | Shortcut
From Clarity PPM Advanced Reporting Home, beneath Dashboards, select Create.
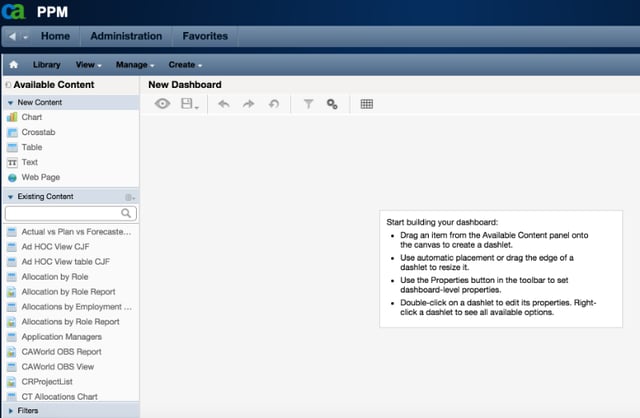
Dashboards bring all of your content together in one place. On the left of your screen, beneath Existing Content, you can see all the content available to create your dashboard. This includes stock reports and ad hoc views.
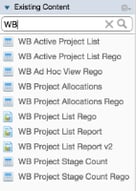
When we search for the recently created content, mentioned above, the list looks like this.
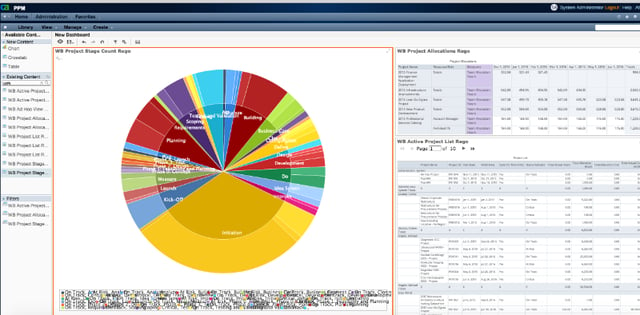
Drag and drop the relevant reports over to the center staging area, and start sizing the boxes by dragging their sides while they load.
Hyperlink Jaspersoft Dashboard Reports
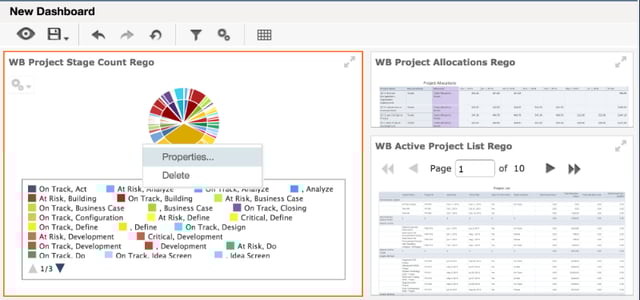
Now you have a dashboard showing the number of projects by stage.
To take your dashboard to the next level, you can hyperlink the reports, or dashlets, so that selecting a section of one report makes the others drill into related data. Right-click on the desired report and choose Properties.
From the Hyperlinks tab, we can enable chart hyperlinks, and update the dashboard here or within a new page.
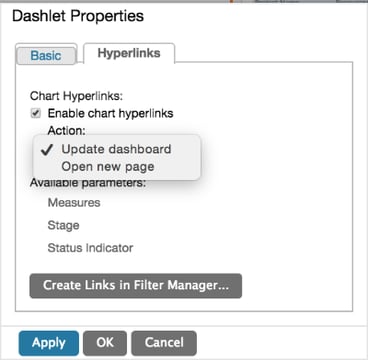
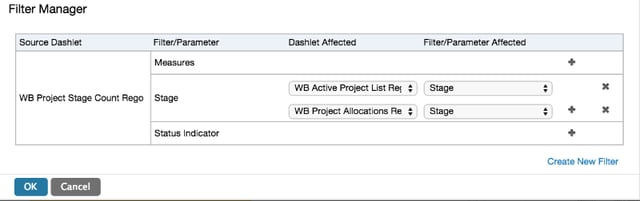
We’ll select “Create Links in Filter Manager,” confirm yes to save dashlet properties and close the window. Now the Filter Manager will bring up the Count by Stage.
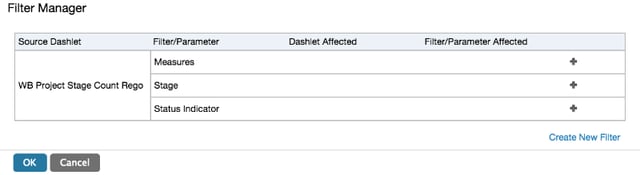
Select the Stage plus icon, add the report to Select Dashlet, and Select Parameter.
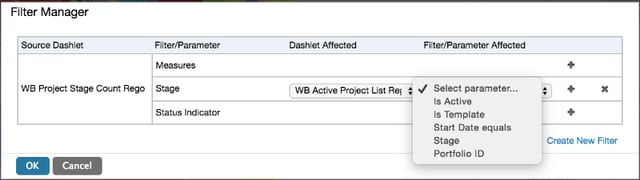
Assign the stage as a parameter by pressing the plus icon again. The same stage will now go to project allocations.
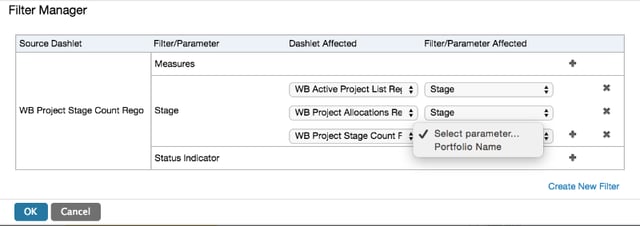
Take Note: If we had added stage to our Project Stage Count report, we could have added it here, as well. Because we didn’t, as you see below, the stage parameter is unavailable. Press OK.
Preview the Jaspersoft Dashboard
To preview your dashboard, click on the eye icon.
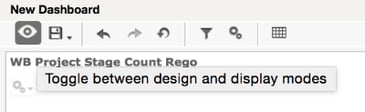
The display mode will allow us to select each report, and view our custom dashboard.
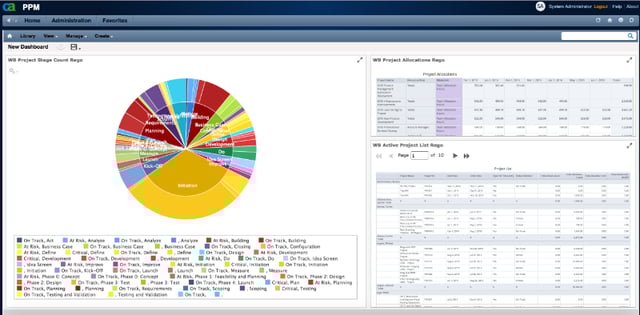
We can click on our Project Stage Count to select a business case. This action will repopulate the data in the Project Allocation and Project List to reflect that selection and show us all the allocations that are related to the case we selected, within that stage.
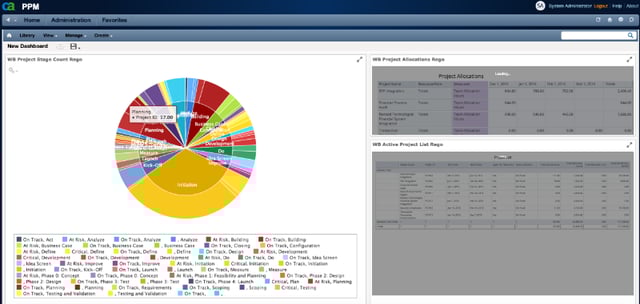
Wow, right? It’s so powerful.
Save the Dashboard
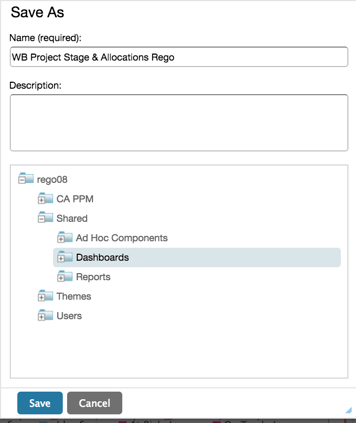
Save the dashboard by selecting the disc icon. We’ll put it in the Shared folder under Dashboards, so we can pull it up by phone or tablet walking into a conference room.
We just created an Ad Hoc Jaspersoft Dashboard showing Projects by Stage.
Rego also offers free health assessments, webinars, and half-day training classes for Clarity PPM on Roadmaps in the Modern UX, Power BI, Portfolio Management, and Jaspersoft.
For a full list of Clarity PPM Services, visit regoconsulting.com.
Join our mailing list below.